Benchmark
Code
The code of the benchmark including utilities to support the dataset can be found on https://github.com/iis-esslingen/rover_benchmark.
Benchmark
We present the results of the experimental evaluation of the SLAM algorithms across a range of sensor configurations and environmental conditions.
Location Specific Results
For each location, we report the Root Mean Square Error (RMSE) of the Absolute Trajectory Error (ATE) in meters, averaged over five runs. Invalid results are highlighted in red. An ‘x’ denotes that no trajectories were generated.
Park
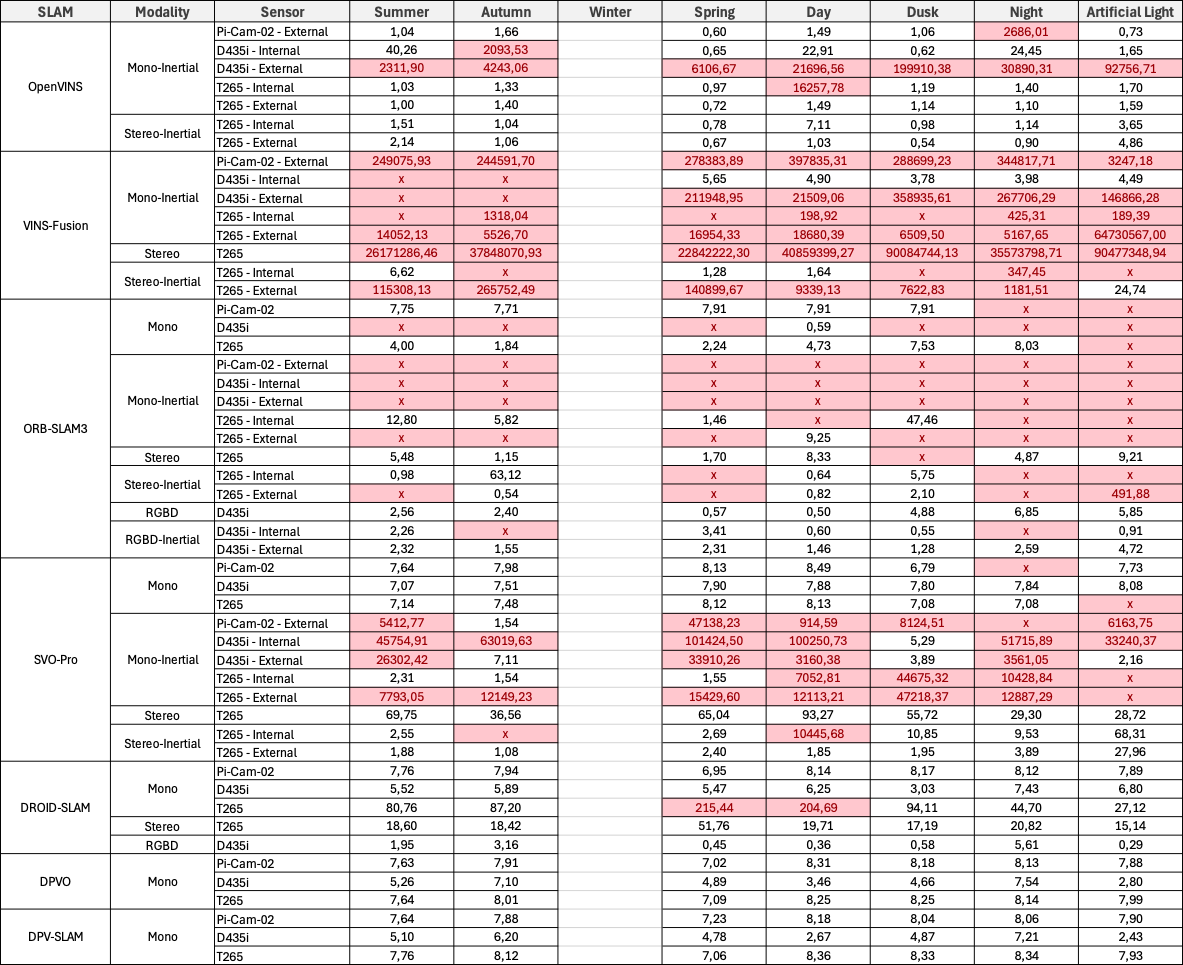
Campus Small
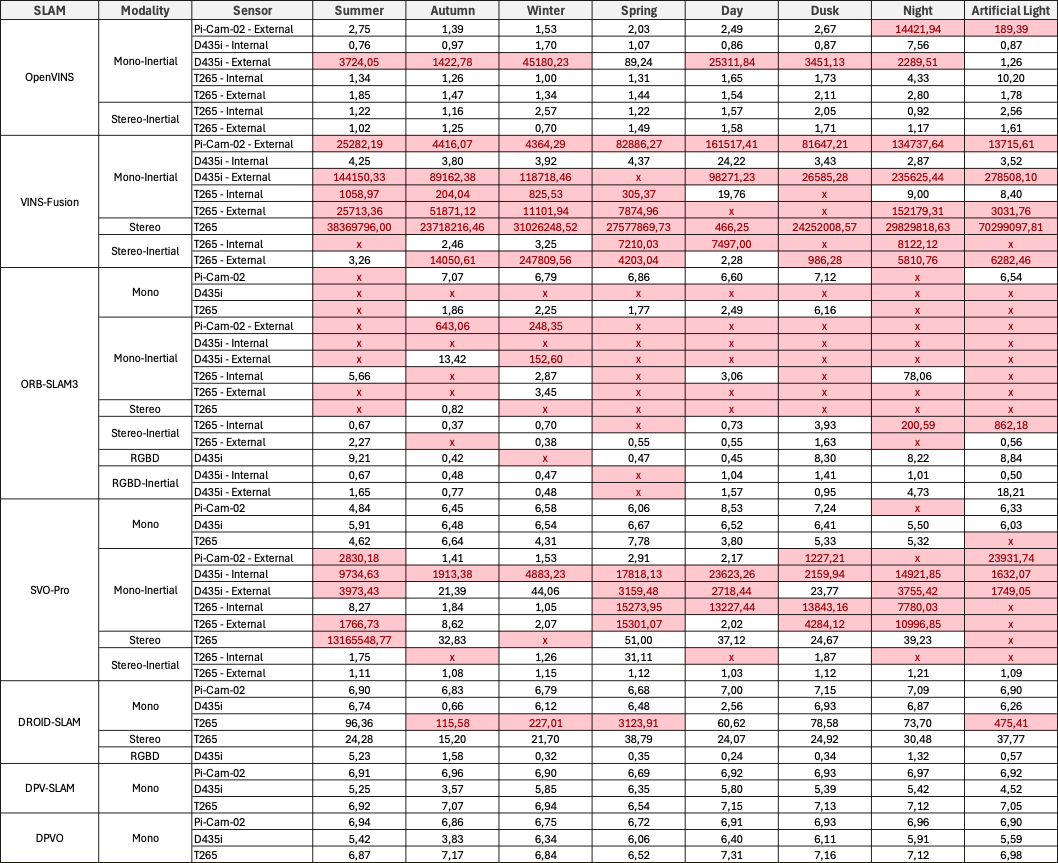
Campus Large
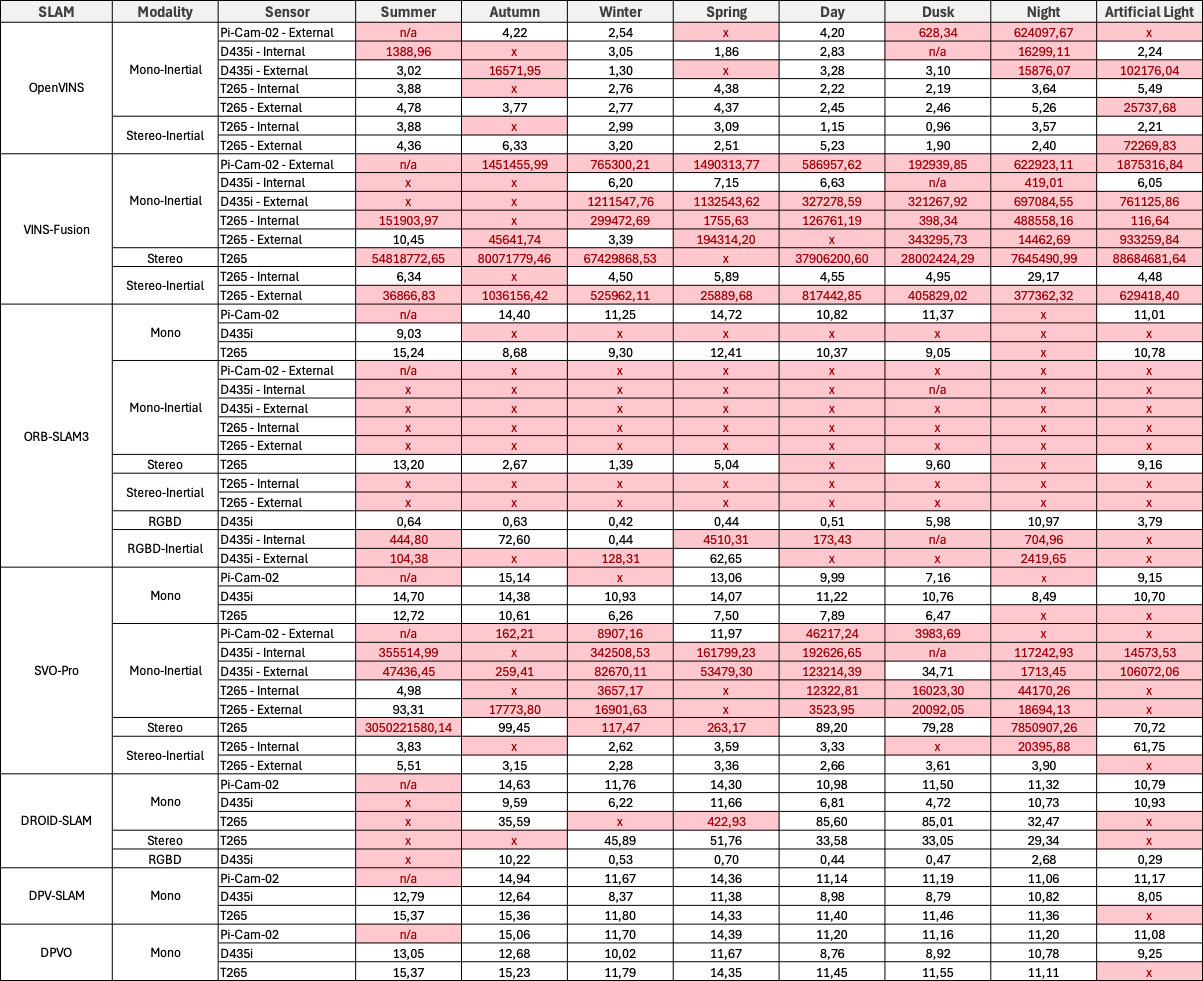
Garden Small
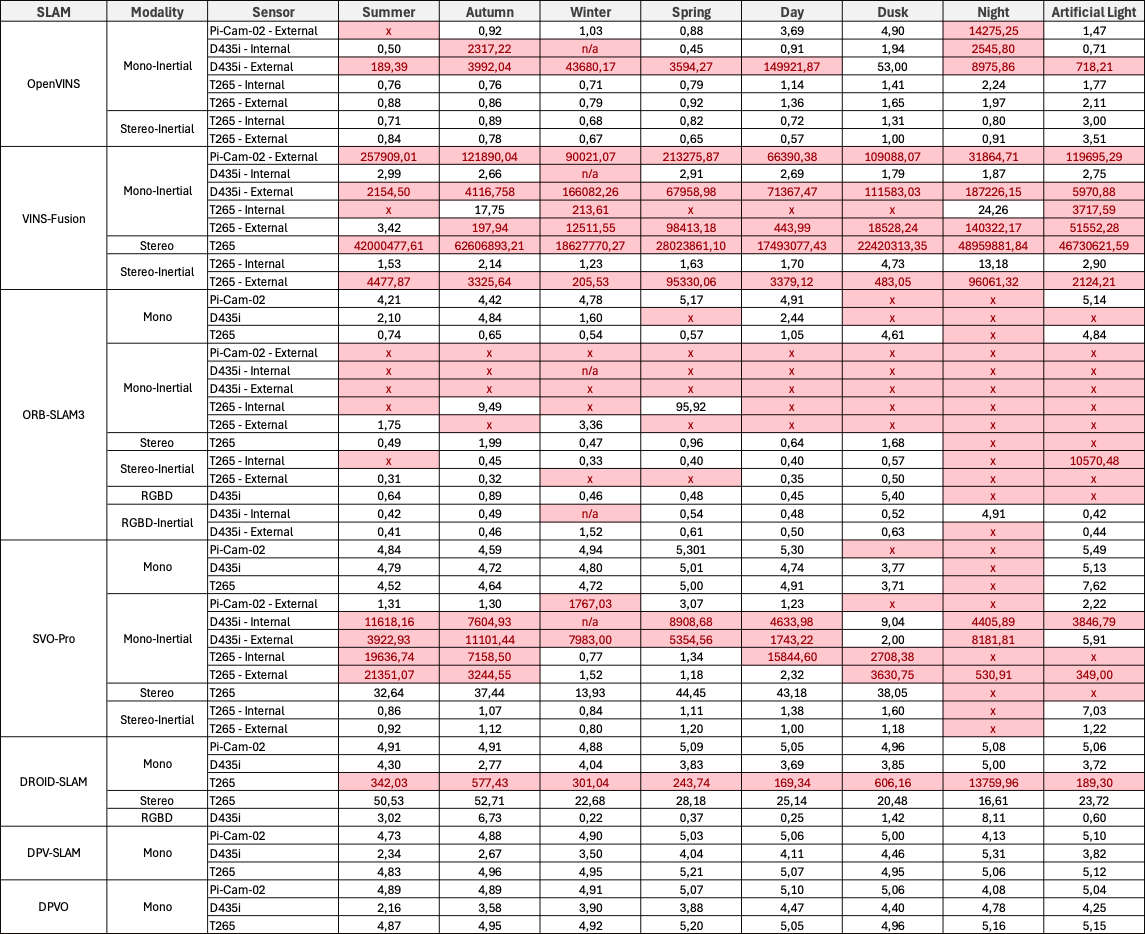
Garden Large
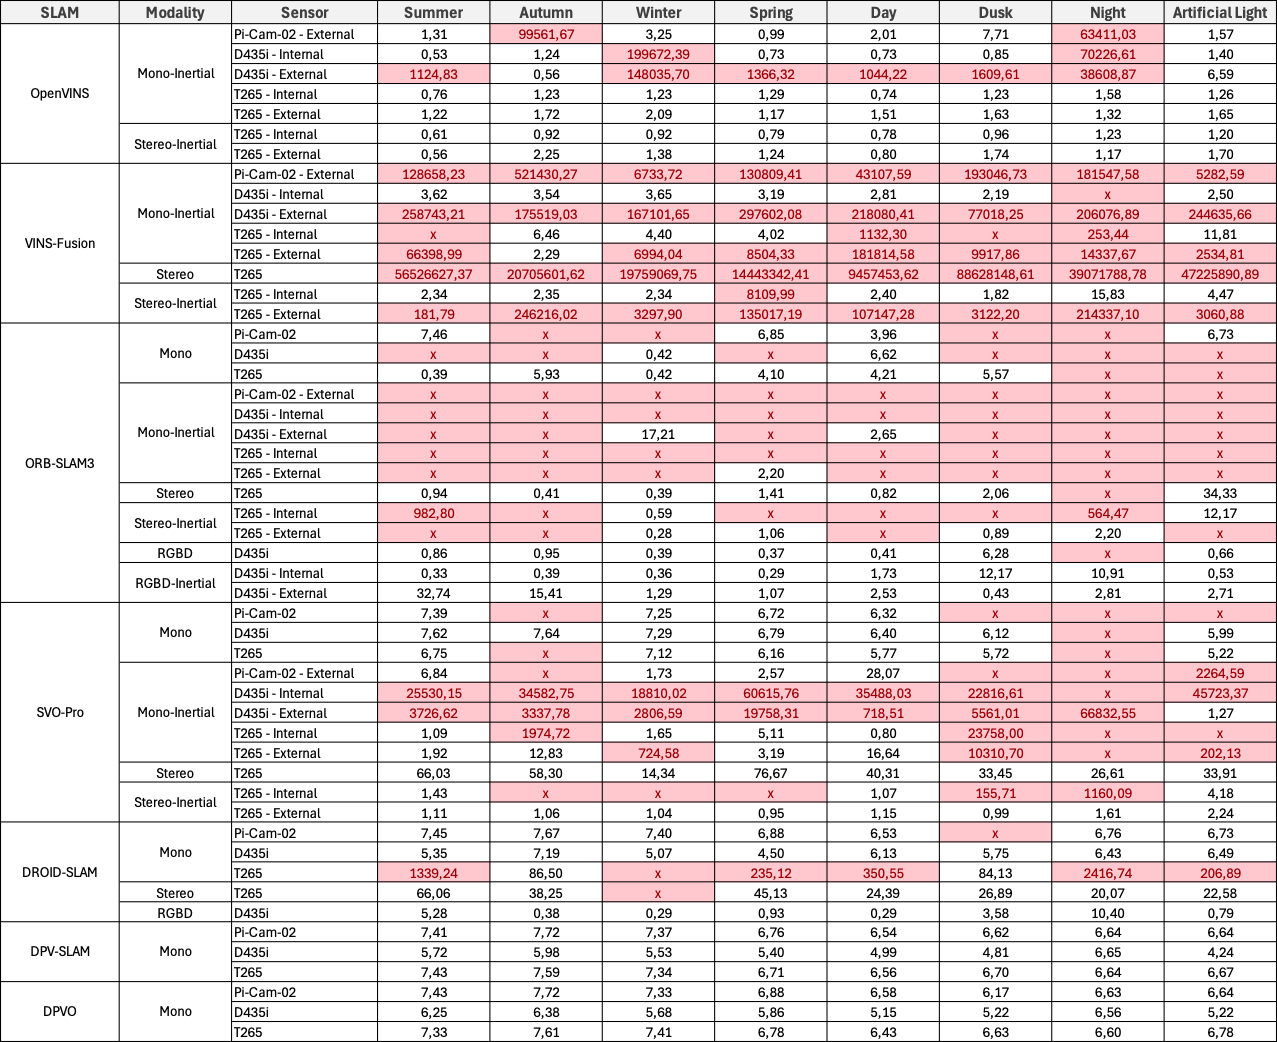
Modality Comparison
Each modality was evaluated across all sequences to assess the impact of sensor configuration on SLAM performance. The results include comparisons between Monocular, Stereo, RGBD, and their inertial-enhanced counterparts, analyzing ATE and success rates to highlight strengths and weaknesses of each configuration. Each cell presents the mean RMSE ATE (in meters) across the five locations – Park, Campus Small, Campus Large, Garden Small, and Garden Large. The second row in each cell shows the mean ATE across all locations, the standard deviation of the ATE, and the Success Rate in percent, calculated as the ratio of valid trajectories to the total number of trials for each configuration. The best and second best results for each location and the overall mean are highlighted in green.
Mono

Mono-Inertial

Stereo & Stereo-Inertial

RGBD & RGBD-Inertial

Environmental Robustness
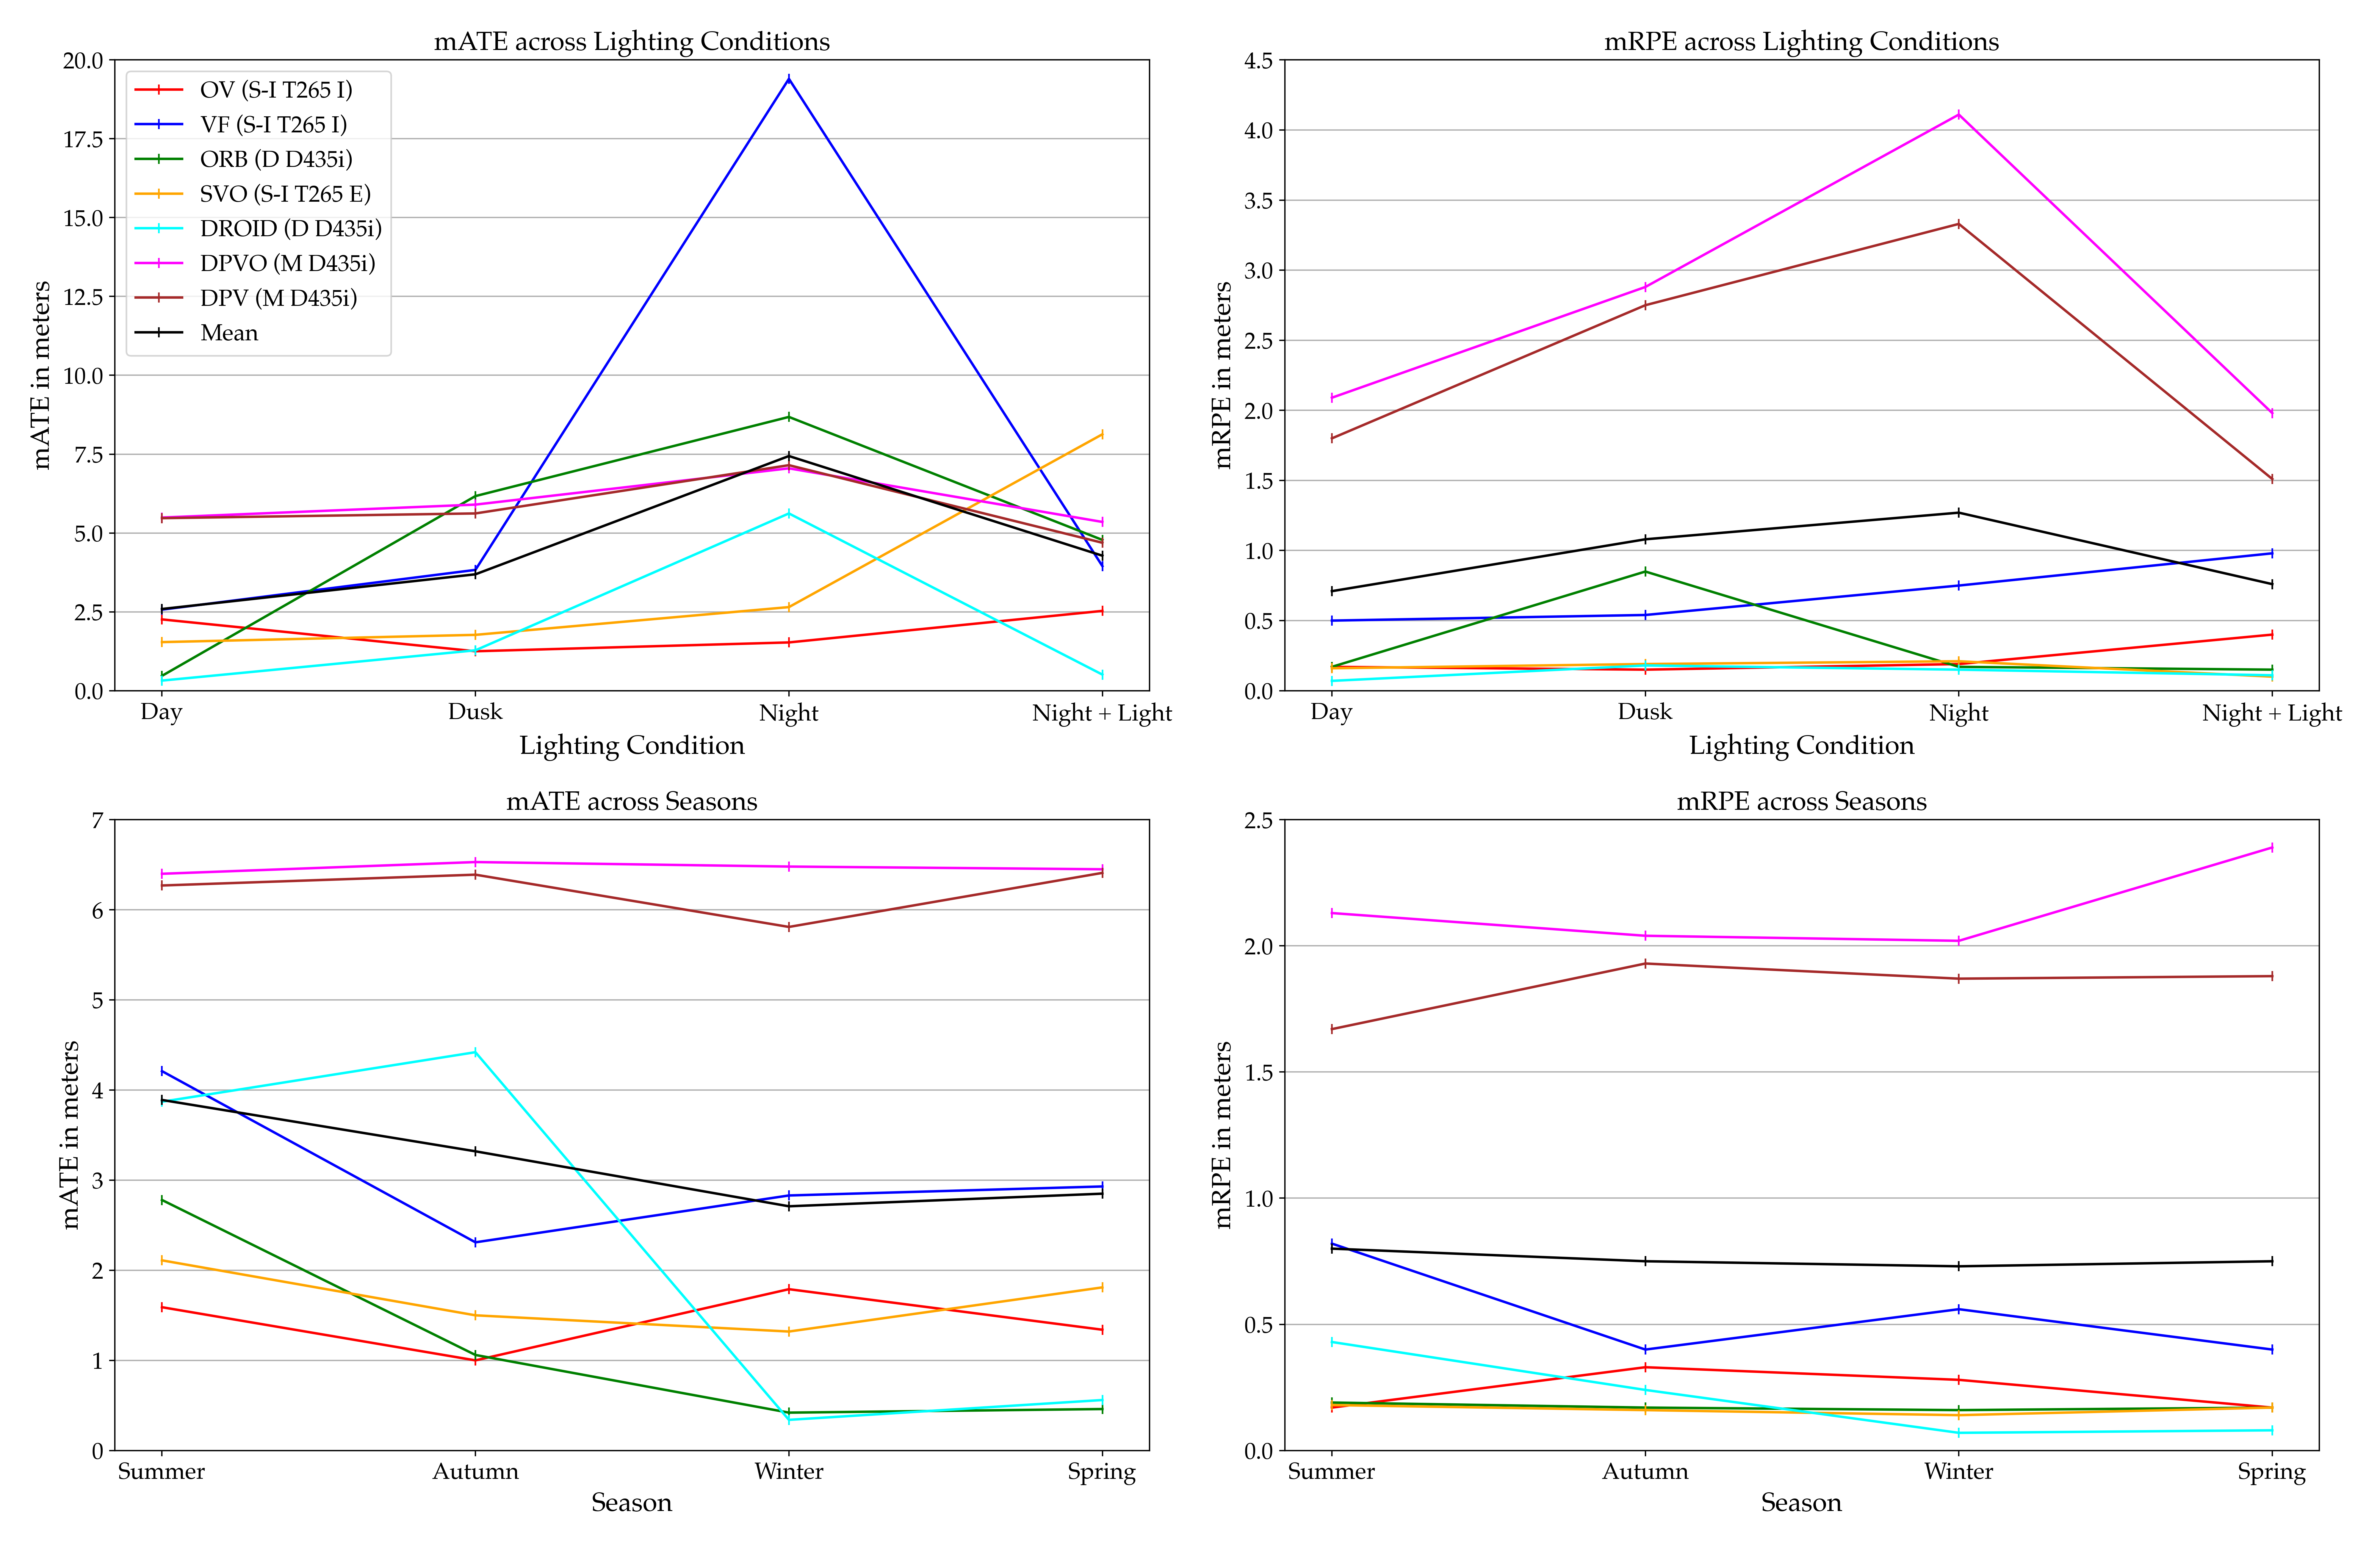
The results of the best-performing sensor configuration of each SLAM method are shown in detail regarding different lighting conditions and seasonality. For each configuration, the mean ATE over five runs for the five locations is reported, along with the average across locations, the standard deviation, and the success rate. Best overall results are highlighted in green.
Lighting Conditions

Seasonality

Summary
